
Data center capacity planning is the work of matching the power, cooling and space you can deliver to the IT load you expect, early enough that new capacity arrives before the old runs out. The hard part is lead time. A conventional build takes 2 to 5 years, so a forecast that is wrong by a few quarters becomes a stalled AI deployment or a stranded budget. Our modular data centers go from site survey to live load in 4 to 6 months, which lets you add capacity in small, planned steps instead of betting on one large build.
This guide is for infrastructure, facilities and procurement leaders at agencies, health systems, telecoms, universities and operators of edge or GPU compute. It covers what capacity means, how to measure it, how to forecast, how much spare capacity to hold, and how modular deployment changes the plan.
TL;DR
- Real capacity is the lowest of your power, cooling and space limits, not the largest number on any one spec sheet.
- Measure actual load first. Nameplate ratings and measured busy-hour draw are different numbers.
- Forecast each constraint on its own curve, with conservative, expected and aggressive scenarios, and hold headroom equal to your installation lead time.
- Phased additions beat one large build. Our container lineup runs from 1 rack and 125 kW to 14 racks and 1.75 MW, live in 4 to 6 months on an existing grid connection.
- Pricing is quoted per project.
Table of Contents
- What data center capacity actually means
- The binding constraint sets your real capacity
- Step 1: Build a baseline from measured load
- Step 2: Forecast demand on separate curves
- Step 3: Decide how much headroom and redundancy to hold
- Step 4: Plan power delivery, not just power use
- How modular deployment fits a capacity plan
- Step 5: Monitor, review and trigger the next addition
- Where capacity planning differs by workload
- What a modular unit offers your plan
- FAQ
- Sources
What data center capacity actually means
Capacity has two common meanings, and mixing them causes bad plans. The Uptime Institute’s glossary separates power demand capacity, the maximum power a data center can draw, from IT equipment capacity, the maximum work the equipment can handle. Facility planners mostly mean the first: how many kilowatts of IT load the site can support.
That number is set by several physical systems working together:
- Power: the electrical chain from the utility feed through UPS (uninterruptible power supply) and distribution to the rack breaker.
- Cooling: how many kilowatts of heat the mechanical plant can remove.
- Space: usable floor area and rack units, including weight limits and clearances.
- Network: free ports and bandwidth per rack, checked against busy-hour traffic.
Total power alone does not describe hosting capacity. Data Center Knowledge notes that a 100 MW site with poor power usage effectiveness (PUE, the ratio of total facility power to IT power) may host fewer workloads than an 80 MW site with more efficient cooling. Read any megawatt figure next to a PUE figure.
The binding constraint sets your real capacity
A facility’s usable capacity is the minimum of its constraints. Oxxon Advisors’ planning model states that sellable capacity is the lowest of power, floor space and cooling, and that the binding one can change over the life of the facility as rack density rises.
This is the pattern behind the familiar complaint that a site has spare power but cannot take another rack. Stranded capacity is capacity you own but cannot use because the other systems are out of balance. A hall may have free breaker positions and no cooling headroom, or free floor and no power distribution.
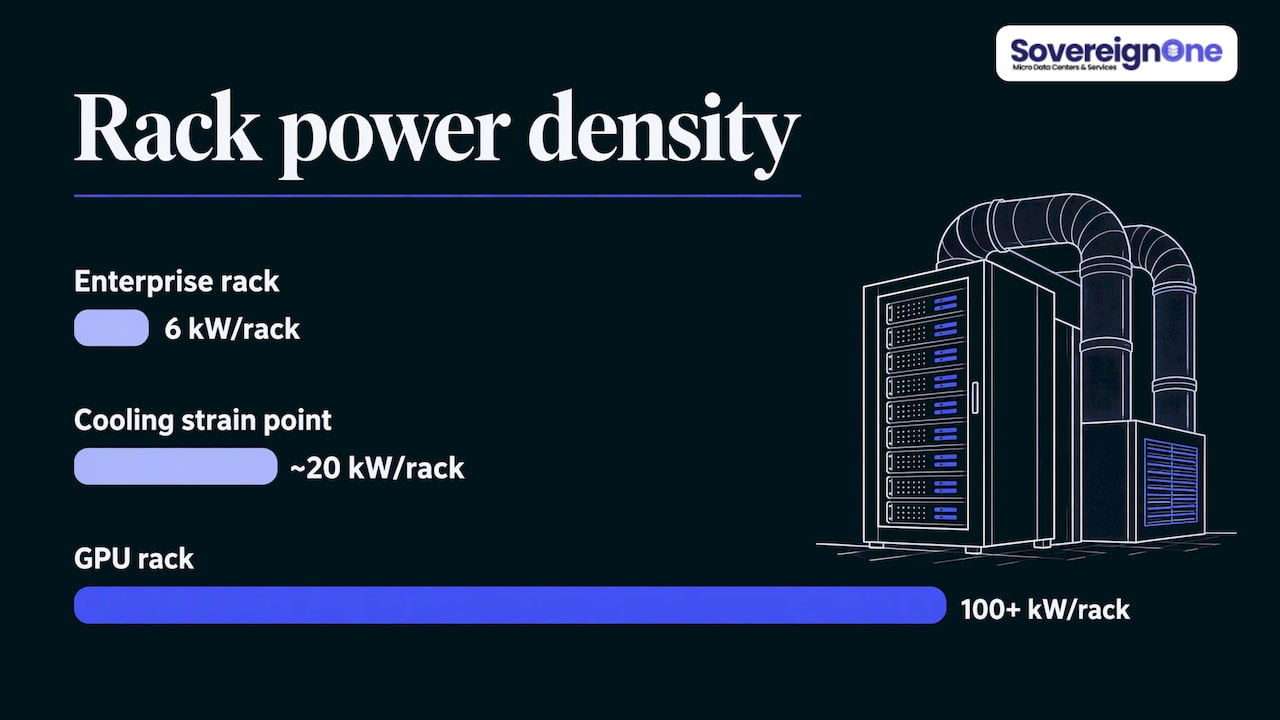
Density moves the constraint. Anvilfield’s field guide notes that every watt drawn returns as heat, and that air cooling struggles beyond roughly 20 kW per rack without aggressive containment. A GPU rack at 100 kW or more is a different planning problem from a 6 kW enterprise rack. For AI and GPU operators, cooling and power distribution usually bind before floor space does.
Cooling is also a large share of the energy bill. Natural Resources Canada’s 2024 best practice guide states that cooling and ventilation typically account for 30% to 55% of data centre power consumption. The cooling design in our containers cuts power and water use for cooling by 30%, which frees electrical capacity for compute.
Step 1: Build a baseline from measured load
You cannot plan on numbers you have not measured. Start with an inventory and a measurement pass:
- List installed capacity at each level. Utility feed, generators, UPS, distribution units, cooling units, rack positions, network uplinks.
- Meter real draw. Use rack-level power readings and branch-circuit monitoring, and record busy-hour peaks, not averages or nameplate values.
- Compute PUE from total facility power and IT power, so you know how much of each incoming kilowatt reaches servers.
- Find stranded capacity. Note rack positions that cannot be filled because of power, cooling or weight limits.
- Check failure states. Confirm that power and cooling still carry the load when one component is out of service.
The output is a table with one row per constraint: installed, usable under your redundancy scheme, measured peak, and remaining. That table is the starting point for every later decision.
Step 2: Forecast demand on separate curves
A capacity plan is a forecast, not a snapshot. Power and cooling demand climb with density at each hardware refresh, while floor space can stay flat. Forecast each constraint separately, using metered history.
A workable method for an enterprise or agency site:
- Collect 12 or more months of metered power by rack group or room.
- Fit a trend and check year-over-year patterns for seasonality, such as fiscal-year purchasing or academic terms.
- Add known projects: a planned GPU cluster, a hospital system migration, a new telecom edge site.
- Produce three scenarios: conservative, expected and aggressive.
- Review quarterly and compare forecast against actual.
Large utilities do this at scale, and their method is instructive. The California Energy Commission’s data center methodology memo for its 2025 forecast applies a 67 percent utilization factor to convert requested capacity into expected demand, because customers rarely draw everything they ask for. The same memo cautions that this factor reflects operating data centers and that facilities built mainly for AI may behave differently. For your own plan, the lesson is to apply a measured ratio of peak draw to provisioned capacity rather than assuming full draw, and to revisit it as GPU load arrives.
E3’s forecasting whitepaper on large loads sorts facilities into existing, under construction, planned and inferred. Internal planners can borrow the same tiers: running load, approved projects, requested projects and speculative growth, each weighted by how likely it is to happen.
Step 3: Decide how much headroom and redundancy to hold
Headroom has two jobs: absorb growth and absorb failure. Treat them separately.
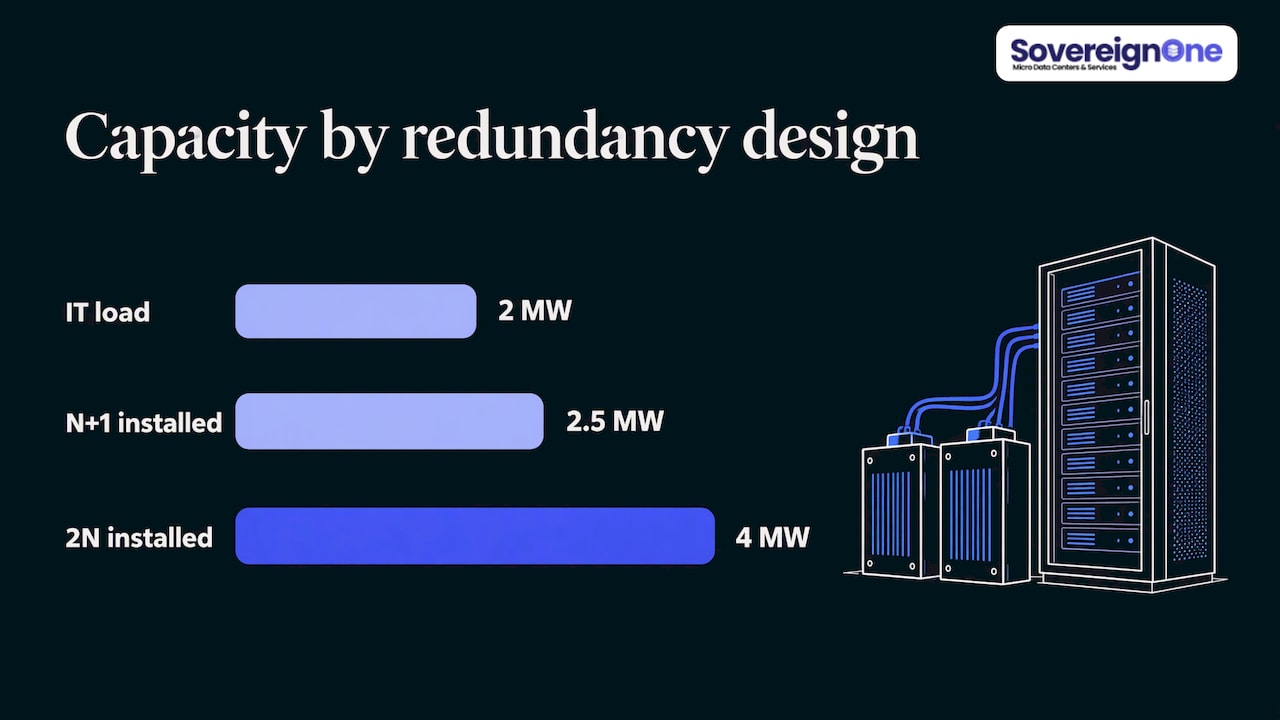
Redundancy reduces usable capacity. Under N+1, usable load is N out of N+1 installed units. Under 2N, half of installed capacity is reserve. Anvilfield warns against sizing the floor to installed rather than usable capacity. On a 2 MW load, N+1 with five 500 kW modules gives 2 MW usable from 2.5 MW installed. A 2N design needs 4 MW installed.
Growth headroom should equal lead time. If new capacity takes 3 years to build, you need 3 years of forecast growth in reserve, which means paying for stranded capacity in the meantime. If new capacity takes 4 to 6 months, you need far less. That is the main planning advantage of a short deployment cycle: reserve requirements fall with lead time.
Efficiency can erode resilience. TechTarget’s resilience playbook warns that squeezing out spare capacity can leave you without enough cooling to carry peak demand after a component fails. Test the degraded state, not only the healthy one.
Oxxon Advisors also advises delivering capacity in tranches scheduled against the forecast and interconnection lead times, since building ahead of demand ties up capital and building behind it caps growth.
Step 4: Plan power delivery, not just power use
For many organizations, the limit is not the building but the grid. A new substation or an interconnect queue can add years, and that delay is often the real constraint on an AI or edge program. Our units deploy on an existing grid connection with no new substation and no interconnect queue, so the plan can start from the power you already have.
That changes the question from “when will the utility deliver” to “how much of my existing feed can I convert to compute.” Measure your spare feed capacity, subtract planned loads, and size the first module to fit. Our guide to site preparation before ordering lists the checks to complete before a unit ships.
How modular deployment fits a capacity plan
A modular data center is a factory-built, pre-tested unit, a container that arrives with racks, power distribution and cooling integrated. Because capacity comes in fixed, known increments, it maps directly onto a phased plan. Our lineup uses one platform at a nominal 125 kW per rack:
| Container | Racks | IT capacity |
|---|---|---|
| 7 ft | 1 | 125 kW |
| 12 ft | 2 | 250 kW |
| 20 ft | 5 | 625 kW |
| 40 ft | 10 | 1.25 MW |
| 52 ft | 14 | 1.75 MW |
A worked example
Suppose a state agency forecasts 2 MW of IT load within three years, with 500 kW needed in the first year.
- Year one: one 20 ft unit (5 racks, 625 kW) covers the 500 kW need with about 125 kW of headroom.
- Year two: add a 40 ft unit (10 racks, 1.25 MW). Total installed is 1.875 MW.
- Year three: add a 12 ft unit (2 racks, 250 kW), reaching 2.125 MW installed.
If the aggressive scenario arrives early, the agency orders the next unit sooner. If demand stalls, it stops. Each step is a purchase decision made with fresher data, not a commitment to a full build on day one. The alternative, a single 2 MW build, means paying for capacity two years before use and living with the forecast you made at the start.
High-density planning is simpler here too. At a nominal 125 kW per rack, the unit is designed around dense compute, and its cooling is integrated rather than retrofitted. The equipment inside comes from familiar vendor platforms, so your own team can maintain and operate it without learning a new system.
Step 5: Monitor, review and trigger the next addition
A plan is only as good as its tripwires. Set thresholds in advance:
- Utilization: peak power divided by installed power. Many planners target steady-state utilization of 50 to 70 percent, according to one 2026 capacity planning guide, which leaves room for growth and failure.
- Remaining time: at the current growth rate, how many months until the binding constraint is full.
- Order trigger: when remaining time equals lead time plus a margin, place the order. With a 4 to 6 month deployment window, that trigger sits much closer to actual need than with a multi-year build.
- Forecast accuracy: forecast against actual each quarter, and adjust the scenarios.
Monitoring tools can automate the data collection and trend analysis, but the decision rule is yours to write: which metric, which threshold, who approves, and how long procurement takes. Government buyers should add the funding calendar to the lead time. Our guide to MILCON data center funding covers appropriation paths for defense projects.
Where capacity planning differs by workload
- AI and GPU compute: density is the driver. Plan cooling and power distribution first and treat floor space as secondary. Utility forecasters themselves note that AI-focused facilities may behave differently from today’s averages, so review assumptions often.
- Edge and telecom: many small sites beat one large one. Capacity must be sized per location, and a 7 ft or 12 ft unit suits a single-site need. See our guide to edge data centers.
- Healthcare, education and local government: steady growth with fiscal or academic cycles. Campus deployments can add capacity next to existing facilities; see campus modular data centers.
- Disaster response, mining, oil and gas: capacity must arrive where the work is. A pre-tested unit shortens the path from site survey to live load.
What a modular unit offers your plan
If your forecast shows a gap and a multi-year build does not fit it, our modular data center containers are designed for this case: factory-integrated and pre-tested, live in 4 to 6 months compared with 2 to 5 years for a typical conventional build, deployed on an existing grid connection. Pricing is quoted per project. To prepare for that conversation, read our list of questions to ask in a modular data center quote and the three numbers to request in modular data center cost per rack.
For a full picture of how the units work, see containerized data centers and how to deploy one, or contact us through SovereignOne with your site’s measured load and forecast.
FAQ
What is the difference between data center capacity planning and capacity management?
Planning looks forward: it forecasts demand and schedules new power, cooling and space. Management is the day-to-day work of tracking what is used, placing equipment and reclaiming stranded resources. The two share the same measurements, and management data feeds the plan.
How far ahead should a data center capacity plan look?
Cover at least your deployment lead time plus a margin, and review quarterly. For a conventional build that can mean 3 to 5 years. With a 4 to 6 month modular deployment, a 12 to 24 month horizon with quarterly checks is practical, with longer scenarios for budgeting.
How much spare capacity should I keep?
It depends on your redundancy scheme and lead time. Under N+1, usable load is N of N+1 installed units, and under 2N it is half of installed capacity. Add growth headroom equal to the time it takes to bring new capacity online.
Which constraint usually runs out first?
At traditional densities it is often power or space. As rack density rises, as with GPU racks, cooling and power distribution tend to bind first. Check all of them at site, room and rack level, and plan to the lowest.
Sources
- Glossary of digital infrastructure sustainability, Uptime Institute
- Beyond Megawatts: Rethinking How We Measure Data Center Capacity, Data Center Knowledge
- Data Centre Capacity Planning Models, Oxxon Advisors
- Data center power density and capacity planning field guide, Anvilfield
- Best Practice Guide for Canadian Data Centres (2024), Natural Resources Canada
- Supporting Document for the 2025 IEPR Forecast, California Energy Commission
- Forecasting Large Loads in the Age of AI and Data Centers, E3
- The new data center resilience playbook, TechTarget
- Capacity Planning for SRE and Infrastructure: The 2026 guide